Tabular Thinking
"Now you're thinking in tables!"
TL;DR - Thinking about our knowledge in terms of tables can help us acquire the following important research habits:
Cultivate and re-use good questions.
Use the very structure of our knowledge to confront us with gaps and steer our research, by learning what we should be looking for and how we can find it.
Progress from data representation to ideation (idea generation) by relying on what we already know (and don’t know) to come up with (and sometimes answer) new questions.
Represent and synthesize the same information in different ways.
Use what we already know as a guide to help us determine how we should handle anomalies: by correcting our data measurements, changing our interpretation of the data, or adapting our model of reality.
Today I’d like to discuss the role of tables in research, and how thinking in tabular terms – by approaching both raw information and knowledge as things to be arranged in tables – can help us make better decisions and come up with new ideas. For this post, you don’t need to know anything about spreadsheet editing software (e.g., Excel), but I’ll assume you’re at least somewhat familiar with high-school level chemistry (and vegetables).
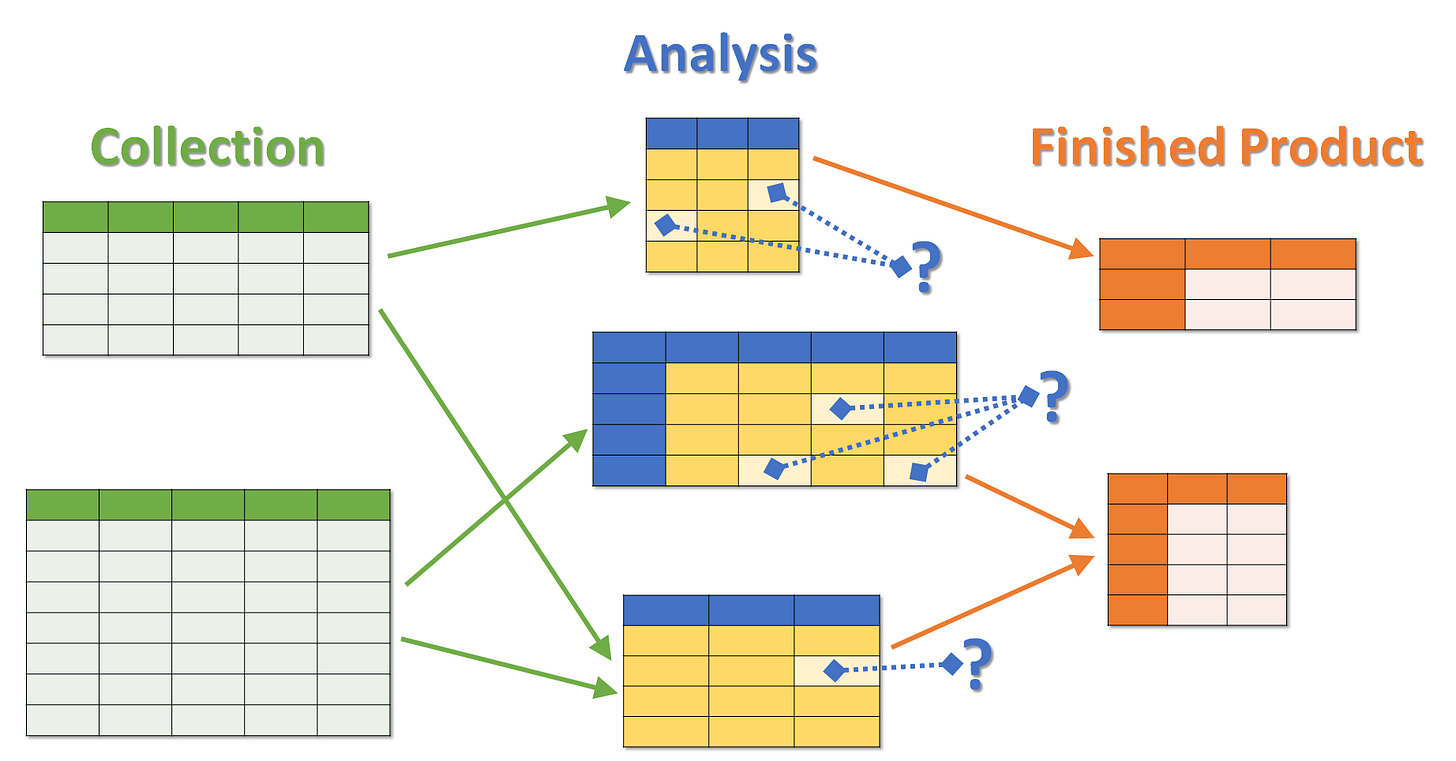
Tables are vital tools for organizing our accumulated information and knowledge in the course of research. While collecting data, we might use several tables (preferably in the form of a database) to properly document and keep track of everything we find, allowing us to support future analysis. Each row in our collection tables should represent an item (such as an article) and each column should represent a field, parameter or question to be answered about the item (e.g., “who wrote this article?”, “when was it written?”, “what is it about?”, etc.).
However, beyond supporting our collection efforts, tables are incredibly useful for analysis as well. Unlike our collection table, each row of our analysis table might represent a subject or aspect of our research (such as a person, place, group, event, phenomenon or thing), rather than a piece of raw information. Our analysis table (or some version of it) could also end up being useful as a means of presenting our conclusions in our final research products.
In purely hypothesis-driven research (wherein we devise a hypothesis and set out to falsify or support it), our columns are usually preset according to our initial research questions, and change little throughout collection and analysis. Conversely, in exploratory research, each new piece of information we discover might teach us to ask new questions about our subject matter – thus evolving our set of columns – as we learn to pay more (or less) attention to certain aspects of reality.
Over time, as we tackle other research problems, it makes sense to re-use good questions, meaning those that have generated answers that have proven useful. This involves relying on our collective experience to incorporate in our paradigms certain parameters we have deemed important, thus developing (unavoidable) biases that determine how we approach research itself. For example, in the course of our cucumber-related research, we might observe that cucumber cultivars each have a different number of seeds, so it would be a good idea to keep this in mind for our approach to tomato-related research as well.
Tabular mindset #1 – Cultivation and re-use of good questions, manifesting in the form of columns (or checklists, which deserve their own post).
Tables have a few mathematically-inclined cousins from which they could probably learn a thing or two, namely arrays, matrices (the plural for matrix, which means wildly different things in different contexts, but you might be familiar with some well-known examples of the type I have in mind) and tensors (which are basically multi-dimensional matrices).
I’d rather avoid the strict definitions of these words altogether, and so instead I’ll blasphemously refer to them as fancy tables. One of the things that makes them fancier than regular tables is their directionality, meaning that columns (and sometimes rows as well) serve much like the axes of a graph, representing some changing quantifiable property such as the progression of time. Moreover, we can also identify trends in other quantifiable properties as we move throughout the table. In other words, there exists a relationship between a cell’s content and its relative position.
For example, consider a geographic map with a coordinate system or grid: we should expect places in the same physical vicinity to be represented by neighboring cells on the map. Additionally, if cells are close to one another, they should exhibit similar climate properties, and local temperature should generally decrease as we move toward the poles.
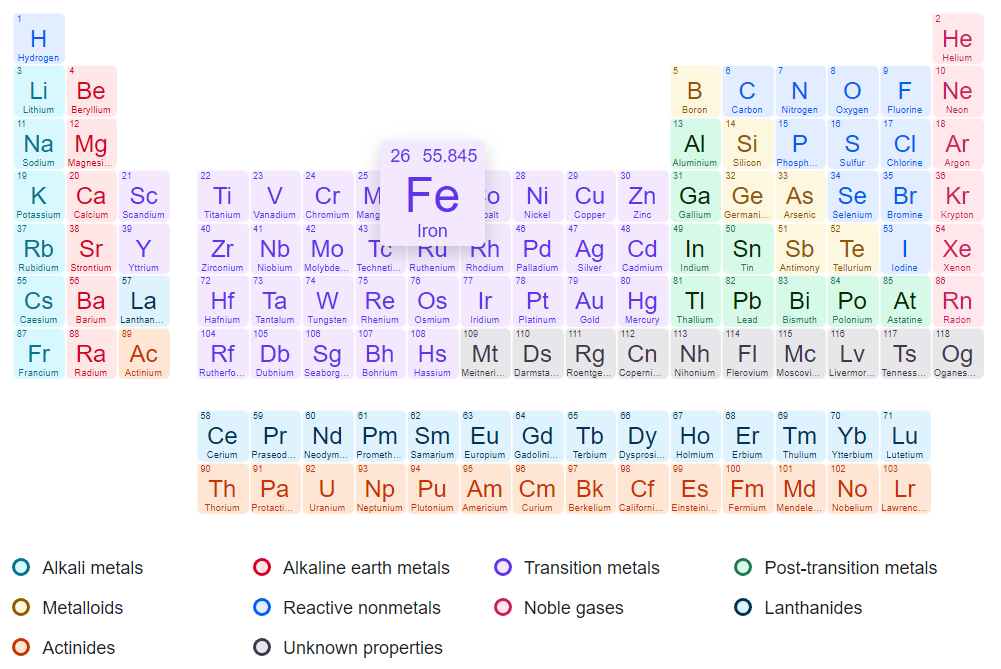
An especially fancy table I’d like to talk about is the periodic table of chemical elements, which organizes elements according to their chemical group and period (represented by columns and rows, respectively).
The periodic table’s fanciness is particularly apparent in its trends – as we move in various directions throughout the table, we can identify changes in certain quantifiable elemental properties (such as atomic radius, electronegativity and metallic character).
One of the utilities of the periodic table as a scientific tool has historically been its power of prediction as a model of reality. In other words, if we accept the table’s premise and validity, then it follows that a gap in the table must indicate an undiscovered element. Moreover, we can predict the properties of this missing element, meaning that we will know what to look for – which might also teach us how to find it – and it will be that much easier to recognize it when we encounter it.
Similarly, as we develop our own analysis table, we will probably need to leave empty spaces for our known unknowns (the things we know that we don’t know). However, the structure and trends of the table itself, along with the content of non-empty cells, may be able to teach us something new about the gaps in our knowledge (much like deducing the contents of a missing square in a Sudoku grid).
Furthermore, we may encounter unknown unknowns as well (surprising gaps in our knowledge that we were previously unaware existed) which is another way our analysis table can teach us important new things about our research domain. This is similar to laying out events on a timeline to better identify missing links or “plot holes” in the narrative (though timelines are more graph-like than table-like, and they also deserve their own post).
Tabular mindset #2 – Using the very structure of our knowledge to confront us with gaps and steer our research, by learning what we should be looking for and how we can find it.
For example, say we have written an analysis table summarizing our knowledge of various vehicles according to their number of wheels, wheel layout and whether or not they’re motorized.
By fancifying our table and correlating number of wheels (a quantifiable property) with wheel layout (a qualifiable property), we can introduce structure and trends that confront us with gaps (known or unknown) in our accumulated knowledge of this particular subject. These can teach us to ask new questions, such as “why haven’t we been able to identify any vehicles with more than two wheels in a sequential layout?” (the answer to which probably has something to do with lateral instability).
Tabular mindset #3 – Progressing from data representation to ideation (idea generation) by relying on what we already know (and don’t know) to come up with (and sometimes answer) new questions.
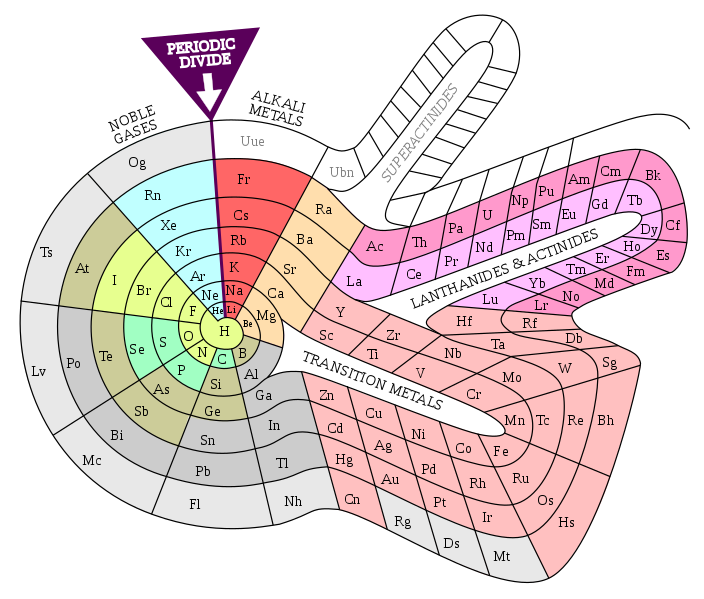
Now, if you’ll allow me another anecdote about the periodic table: there in fact exist multiple alternative methods of tabulating the elements – all scientifically sound – each set up according to a different organizing principle meant to emphasize different chemical or physical phenomena.
In the same way, our analysis table might take different forms over the lifetime of our research, its structure evolving according to our current data set and whatever research questions we are in the midst of tackling. It’s also quite possible to have multiple equivalent analysis tables, each relying on the same data set. We might also find it helpful to split larger tables into several smaller ones, each focused on a different specific facet of our research.
Tabular mindset #4 – Representing and synthesizing the same information in different ways.
Speaking of models, what if our data doesn’t fit? Well, we should usually take this to mean that it’s faulty (perhaps our instruments require recalibration), or that we’re misinterpreting it somehow. But it could also mean that our model is partially or wholly incorrect, and must change in order to accommodate our strange new data. In tabular terms, this could mean adding new columns, changing existing ones, splitting them up, or restructuring entirely.
Understandably, this last option is considered less likely in the case of well-established models (and such claims will undoubtedly encounter resistance), but revolutions have happened before, and we must accept their possibility, especially during the stages of early hypothesizing.
Tabular mindset #5 – Using what we already know as a guide to help us determine how we should handle anomalies: by correcting our data measurements, changing our interpretation of the data, or adapting our model of reality.
In conclusion, the use of tables and one’s ability to fancify them are critical skills at nearly every phase of research: tables streamline our collection process, greatly improve our analysis, and make our products easier to understand. However, actually using a table isn’t always necessary for analysis – the point is to acquire the habits of tabular thinking.


